Originally published on fastradius.com on July 26, 2021
Surface finish is a measurement of the overall texture of a surface, consisting of three key elements: lay, waviness, and roughness. Lay refers to the dominant pattern on the surface, often produced by the manufacturing process itself, waviness measures the periodic variation in surface finish, and roughness is a calculation of the relative smoothness of a surface’s profile.
Surface finish is important for more than just aesthetics — it often determines how the part will react and perform in its end-use environment. A rough surface finish can be prone to wear and tear or create opportunities for breaks and corrosion in some applications. However, it can also help to hide scratches and imperfections better than a perfectly smooth finish.
Roughness is the most commonly referenced element of surface finish. In fact, “surface roughness” is what many machinists actually mean when they say “surface finish.” For the purposes of this article, we’ll be using “surface finish” as an umbrella term that includes (but is not limited to) roughness as we discuss how to measure surface finish.
Surface finish can be measured in a number of ways, including direct measurement, non-contact, comparison, or in-process methods.
Direct measurement, or “contact,” methods use a stylus, like the needle of a record player, to physically measure surface finish by creating a profile of its roughness parameters. Non-contact methods replace this stylus with optical sensors and lights or ultrasonic pulses.
Comparison methods involve creating a surface finish sample using the same equipment or process. These techniques, which typically include simple visual or tactile verifications, can be useful when roughness parameters need only be approximate. These methods are obviously not ideal for verifying fine details or tight tolerances, however. In-process methods determine comparative roughness parameters mid-production process, achieved through the use of techniques like machine vision, magnetic inductance, and ultrasound.
When it comes to taking surface roughness measurements specifically, there are three primary method types — profiling, area, and microscopy techniques. Profiling techniques take measurements of the part’s surface with high-resolution scanning probes. Area techniques, such as optical or ultrasonic scattering, measure a region of the surface and use statistical models to extrapolate the rest of the part’s surface topology.
Electron microscopy techniques enable machinists to examine surface finish in fine detail, but these tools are limited by their small fields of view. The scale that electron microscopes operate on only allows for a small section of surface to be viewed at any given time, requiring multiple scans to establish average roughness parameters.
The first time you see a surface finish chart, you’ll likely find a range of abbreviations that you haven’t encountered before. Here are three of the most commonly used surface roughness symbols and parameters to know:
Surface finish charts are typically measured in micrometers or microinches — the smaller the measurement, the finer the surface finish. To put a few numbers in practical terms:
Achieving a proper surface finish does more than just make parts aesthetically appealing to customers. It also helps to ensure that the piece functions as intended. Surface roughness can be measured in a variety of ways, but the techniques listed in this article are a very general survey of the methods of measuring surface finish.
The subject can quickly become complicated — but that’s what the experts at SyBridge are here for. From part design to post-processing and surface finishing, our team of engineers is ready to help ensure that you achieve the best possible results for your part. Contact us to get started.
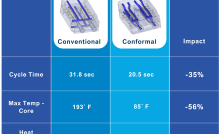
Forget typical cycle times. We're pushing the boundaries of conformal cooling. While traditional approaches deliver…
Forget typical cycle times. We're pushing the boundaries of conformal cooling. While traditional approaches deliver…
From left to right: Brayden Janak (apprentice); Logan Vifaquain (CNC machining, Programming and CMM); Ron…
SyBridge Technologies is proud to announce we have been awarded the 2023 General Motors Supplier…
Today, designers and engineers are accustomed to working with digital tools in their day-to-day jobs.…
Optimizing Your Injection Molding Process for Cost-Effective Manufacturing Excellence In today’s competitive landscape, manufacturers are…